We’ve created over 40 indexes that are directly used to form funds such as ETFs to be trading in market every day. Often you may ask the following questions:
What are they? with respect to categories, how many are US, how many Europe, how many in Asia? with respect to strategies, how many are thematic, how many are others, if other what strategies are they? What’s the Industry distribution?
How big are they? What’s the total AuM of these funds? Among them, how many are above $1 Billion, how many are over $100 Million, and how many are over $10 Million?
What are their performance compared to their respective benchmarks?
First, click this link to gain a full view of our 55 indexes sponsoring ETF/ETN/Mutual Funds, or a partial look as below
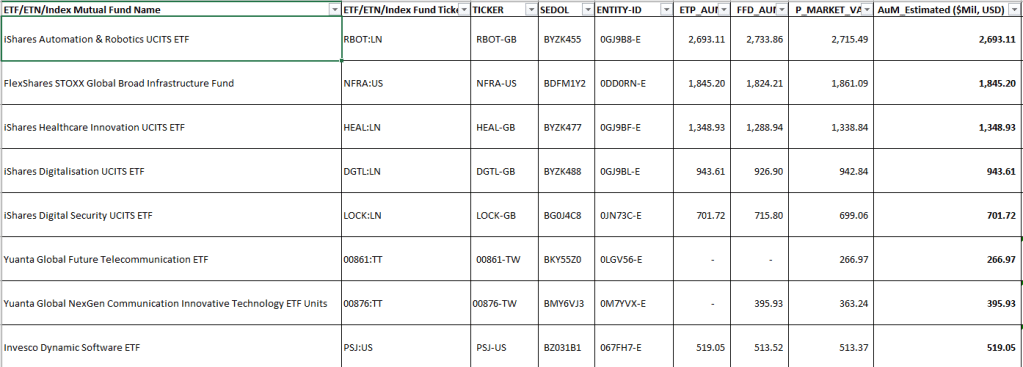
Among the 55, 44 has ticker names with listed exchange,
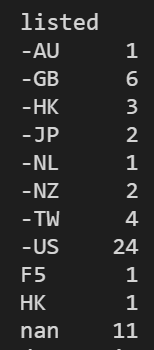
So roughly there are 55% US funds, 20% Asia (Taiwan 4, Hong Kong 3 and Japan 2), the rest are categorized as European, occupying 30%.
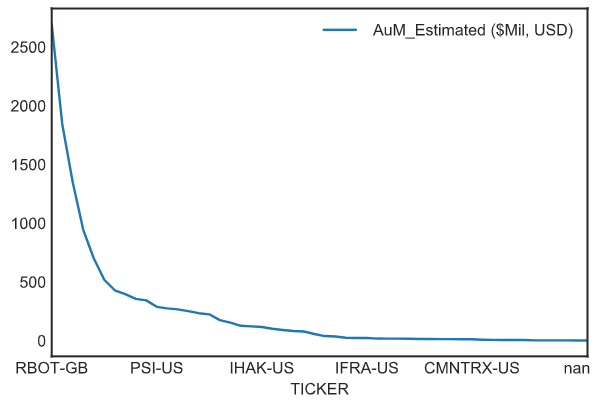
The total AuM at present is $12.6 Billion. There are 22 funds (41%) with AuM greater than $100 M, but contribute 95% of the total AuM. There are only 6 funds (11%) has AuM greater than $500 M, but contribute 64% of the total AuM.

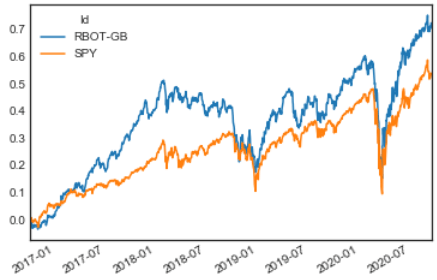
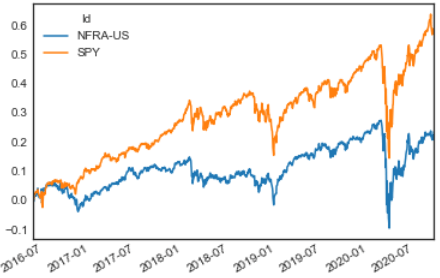
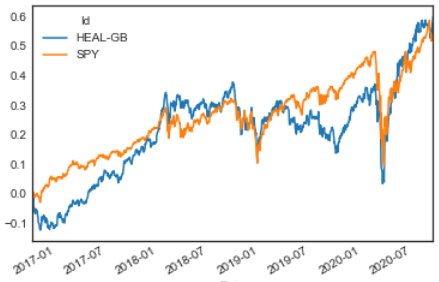
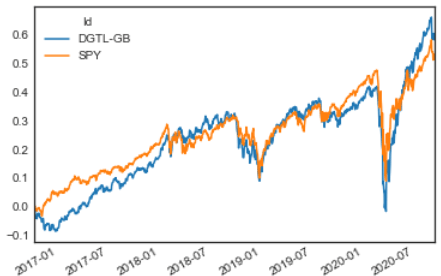
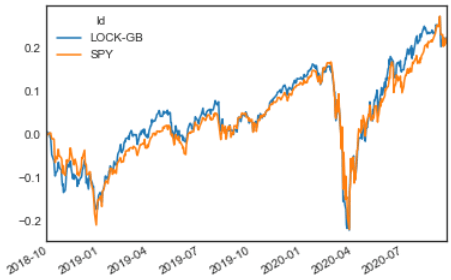
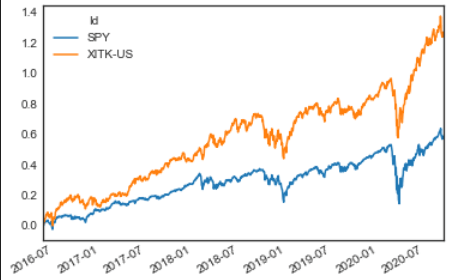
Now we’d look into their performance. From top down let’s view it one by one since the fund’s inception date: