2. pytexas woman talk about topic modeling in python

3. google talk online news and reviews

ASUM, aspects/attributes, sentiment affective words evaluative words and aspec-specific evaluative words, fine grain, domain specific meaning, Aspect Sentiment Unificaiton Model and Sentence LDA.


ultimate article on using gensim to do topic modeling by data scientist at GM – Selva Prabhakaran
All LDA does is it rearrange the topics distribution within the documents and keywords distribution within the topics to obtain a good composition of topic-keywords distribution.
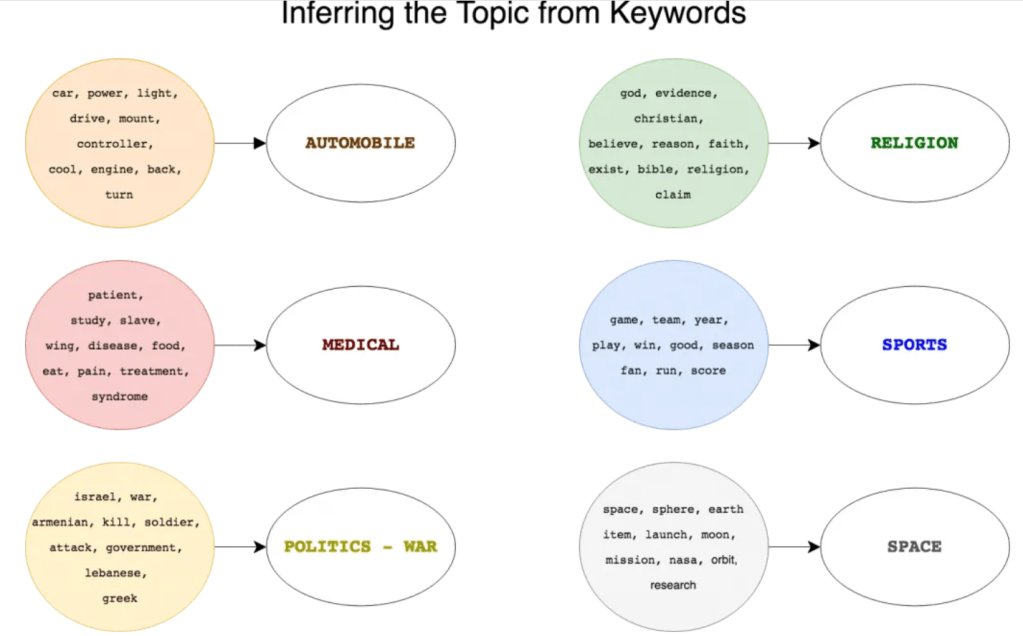
Human inferring is needed in interpreting topics:
There are two hyperparameters alpha and beta. alpha controls per document topics, and beta controls per topic word distribution. A high alpha tries to cover as many as possible topics, similarily, a high beta tries to cover most of the words in one topic, a low beta only aims to contain only a few of the words but accurately.
high alpha to make documents more similar and high beta makes topics more similar.

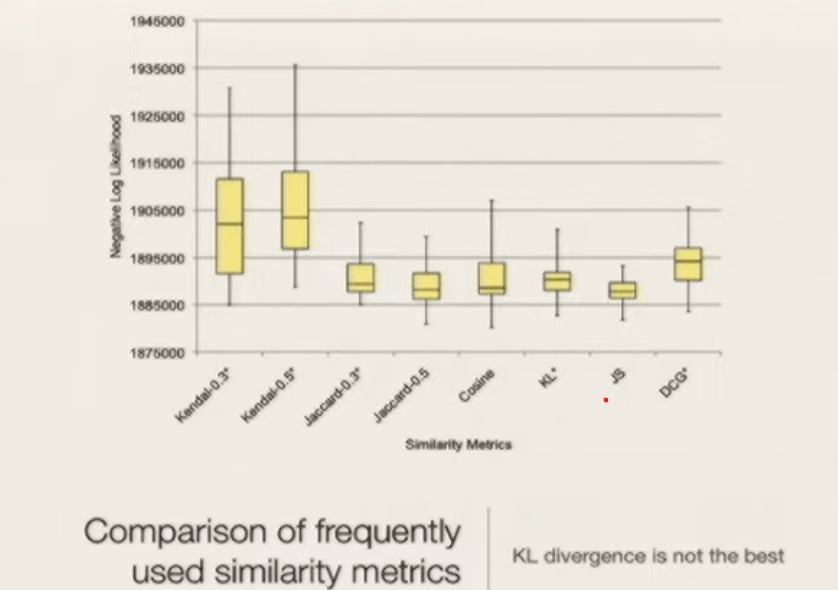
How to interpret the bar sliding on relevancy in LDAvis?, referencing the original academic paper: LDAvis: A method for visualizing and interpreting topics by Carson and Kennith.
“propose ranking terms for a given topic in terms of both the frequency of the term under that topic as well as the
term’s exclusivity to the topic, which accounts for the degree to which it appears in that particular topic to the exclusion of others”. How to decide these terms as well as their rankings? There are a lot of efforts in tackling it. “a quantity called lift, defined as the ratio of a term’s probability within a topic to its marginal probability across
the corpus. This generally decreases the rankings of globally frequent terms, which can be helpful.” It could be noisy or hard to interpret as a rare word can differentiate topics effectively but meanwhile not yielding prevalence. LDAvis adopts a method that is a weighted average of the logarithms of a term’s probability and its lift.
Maximum Likelihood Estimation of Dirichlet Distribution Parameters by Jonathan Huang, It uses a coin flipping case to illustrate probability ditribution:
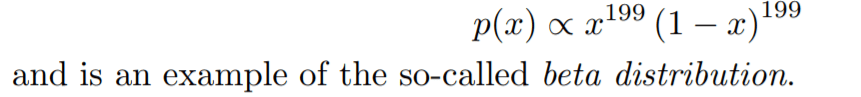
A generalization of the beta distribution to higher dimensions leads to the Dirichlet.
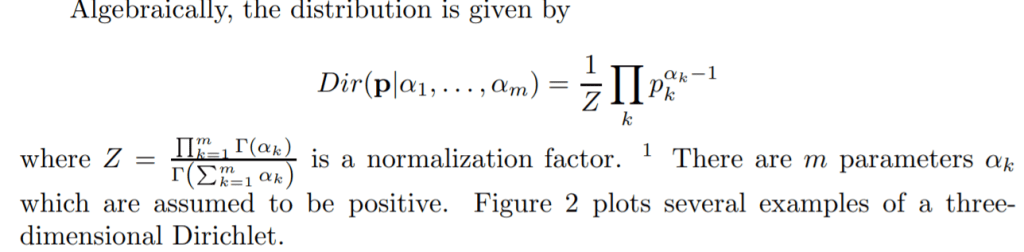

Dirichlet provides the prior for distribution.
There are several methods to numerically maximize the objective function:
First is Gradient Ascent. The first method to try is Gradient Ascent, which iteratively steps along positive gradient directions of F.
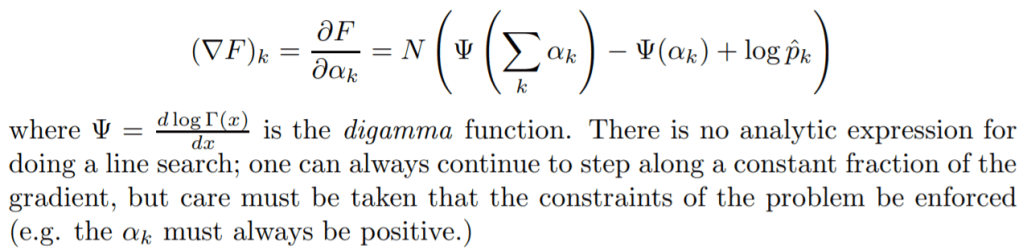
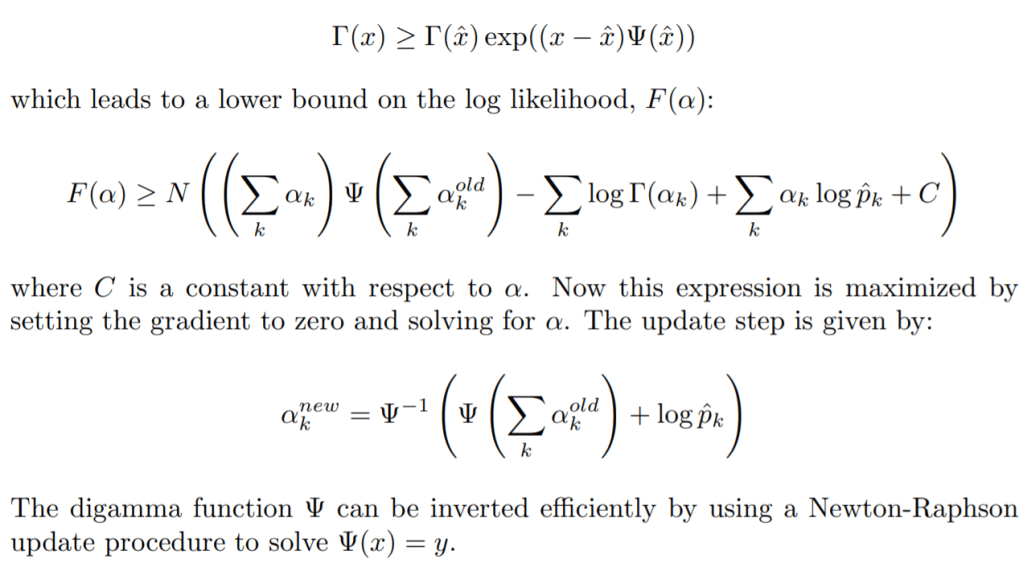
Second is a Fixed Point Iteration. Minka [1] provides a convergent fixed point iteration technique for estimating parameters. The idea behind this is to guess an initial α, find a function that bounds F from below which is tight at α, then to optimize this function to arrive at a new guess at α
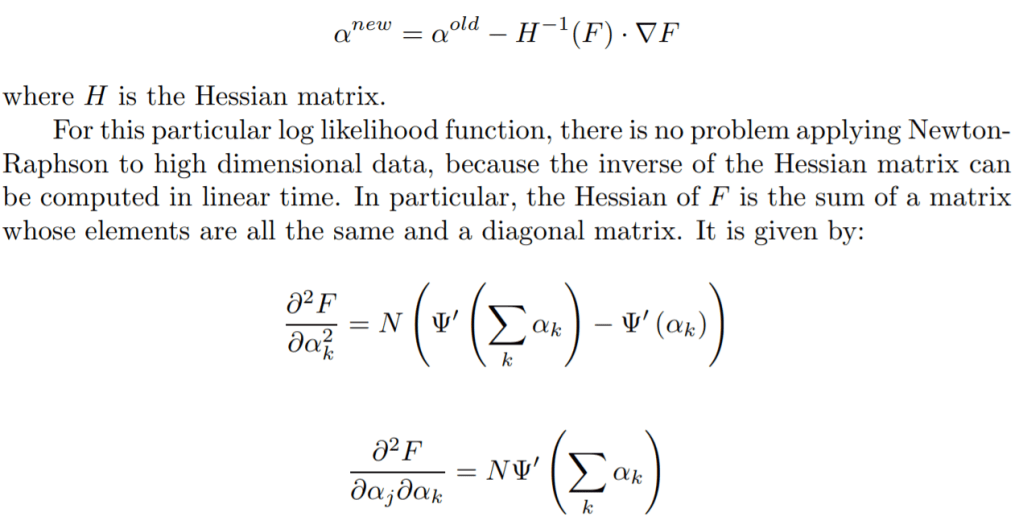
Third is the Newton-Raphson Method. Newton-Raphson provides a quadratically converging method for parameter estimation. The general update rule can
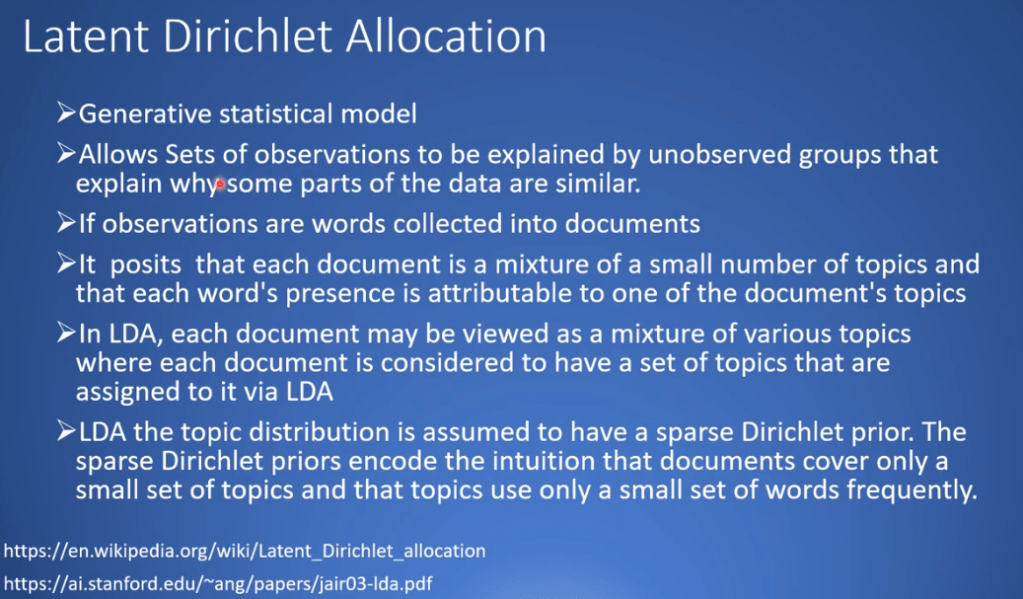
The example that motivated this project comes from latent semantic analysis in text modeling. In a commonly cited model, the Latent Dirichlet Allocation model [3], a Dirichlet prior is incorporated into a generative model for a text corpus, where every multinomial drawn from it represents how a document is mixed in terms of topics. For example, a document might spend 1/3 of its words discussing statistics, 1/2 on numerical methods, and 1/6 on algebraic topology
1/3 +1/2 + 1/6 = 1 for a large number of possible topics, fast maximum likelihood methods which work well for high dimensional data are essential, and I reviewed some alternatives to Gradient Ascent in this paper. Due to several important properties such as having sufficient statistics of bounded dimension, and a convex log-likelihood function this computation can be made quite efficient.
2014 LDAvis: A method for visualizing and interpreting topics by Carson at Iowa State University and AT&T Lab Research. It present LDAvis, a web-based interactive visualization of topics estimated using Latent Dirichlet Allocation that is built using a combination of R and D3. There are two major novice methods, one is choosing which terms to present to a user to aid in the task of topic interpretation, in which we define the relevance of a term to a topic rather than the probability of term under a topic; second, describe LDAvis to flexibly explore topic-term relationships using relevance to better understand a fitted LDA mode.
LDAavis is motivated to create to solve these three questions: (1) What is the meaning of each topic?, (2) How
prevalent is each topic?, and (3) How do the topics relate to each other?
They offer “relevance of a term” to a topic that allows users to flexibly rank terms in order of usefulness for interpreting topics. It is well-known interpreting topic with relevant terms is hard in LDA, multiple papers were written to tackle it. Newman et al. (2010) describe a method for ranking terms within topics to aid interpretability called Pointwise Mutual Information (PMI) ranking. Taddy (2011) uses an intrinsic measure to rank terms within topics: a quantity called lift, defined as the ratio of a term’s probability within a topic to its marginal probability across the corpus. This decrease the ranking of globally frequent terms. Bischof and Airoldi (2012) develop and implement a new statistical topic model that infers both a term’s frequency as well as its exclusivity – the degree to which its occurrences are limited to only a few topics. It a FREX score (“FRequency and EXclusivity”) which is a weighted harmonic mean of a term’s rank within a given topic with respect to frequency and exclusivity, and they recommend it as a way to rank terms to aid topic interpretation. Setting lamda parameter is important so the definition of lambda is to determines the weight given to the probability of term w under topic k relative to its lift (measuring both on the log scale):
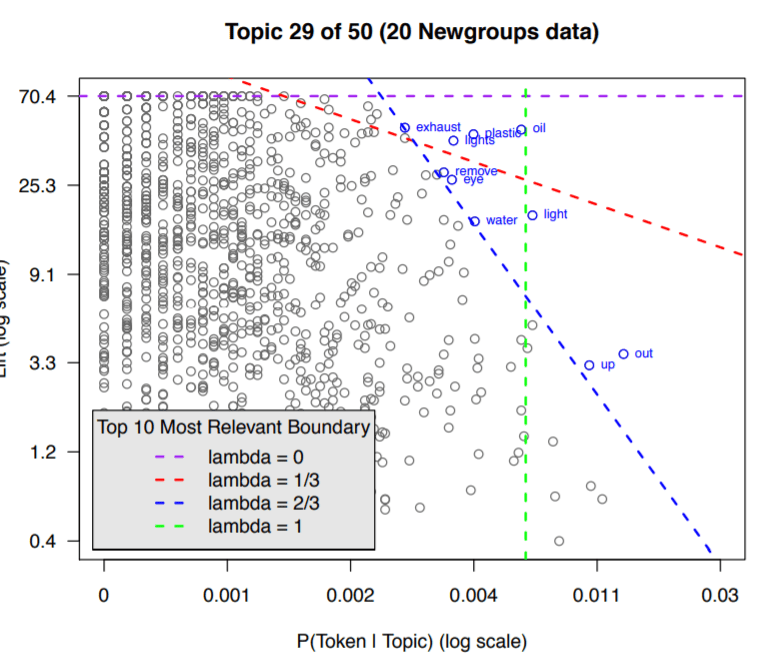
Then the next question is how to pick the lambda value to aid topic interpretation. If = 1, terms are ranked solely by kw, which implies the red bars would be sorted from widest (at the top) to narrowest (at the bottom). the areas of the circles are proportional to the relative prevalence of the topics in the corpus
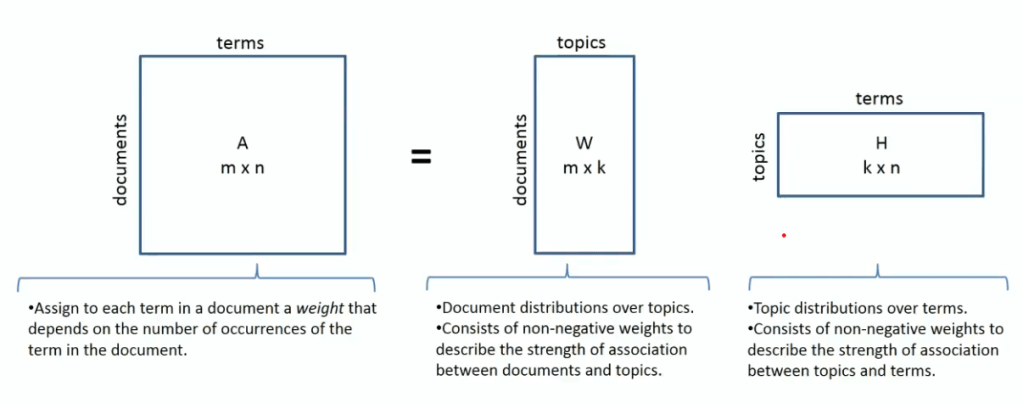
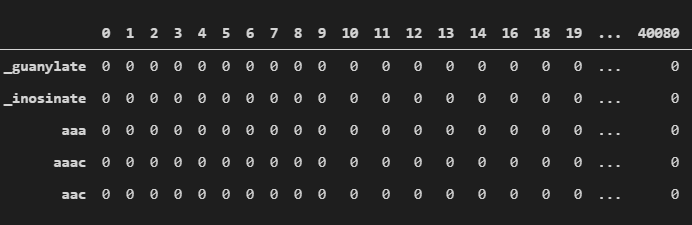
tdm (term document matrix)
sparse_counts = scipy.sparse.csr_matrix(tdm)
corpus = matutild.Sparse2Corpus(sparse_counts)
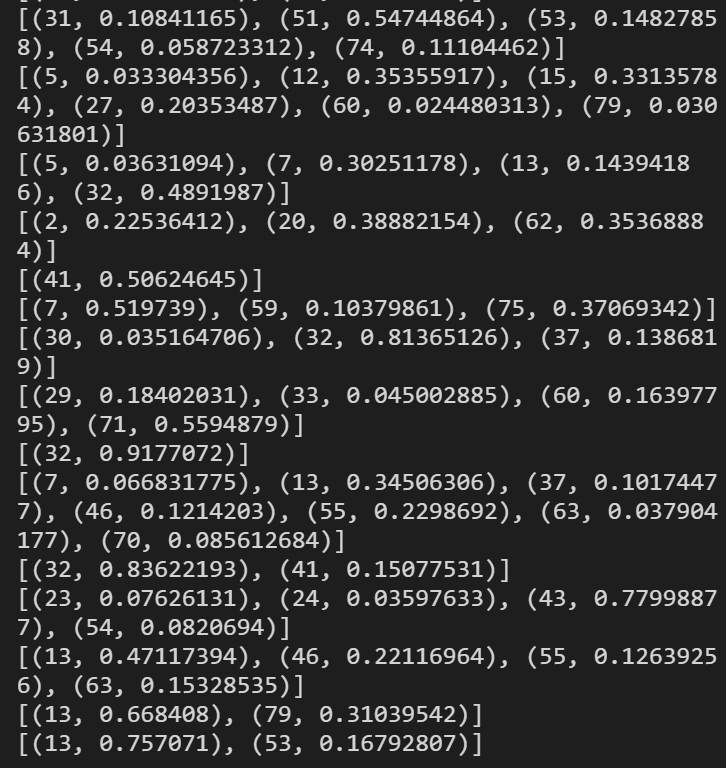
lda[corpus], it’s hard to see the object structure, so reference a blog(insert author name)’s script here to show
for i, row_list in enumerate(corpus_transformed):
row = row_list[0] if lda.per_word_topics else row_list
print(row)
row = sorted(row, key=lambda x: (x[1]), reverse=True)