According to its website,
The ATAC Credit Rotation ETF (Ticker: JOJO)
- In offensive mode, JOJO can invest in high yield/junk bond ETFs.
- In defensive mode, JOJO can invest in long-duration Treasuries. The indicator that triggers the offensive or defensive position is driven by the behavior of Utilities relative to the broad stock market, a historically leading indicator of market volatility, which is evaluated on a weekly basis for potential rotations in the exchange traded fund.
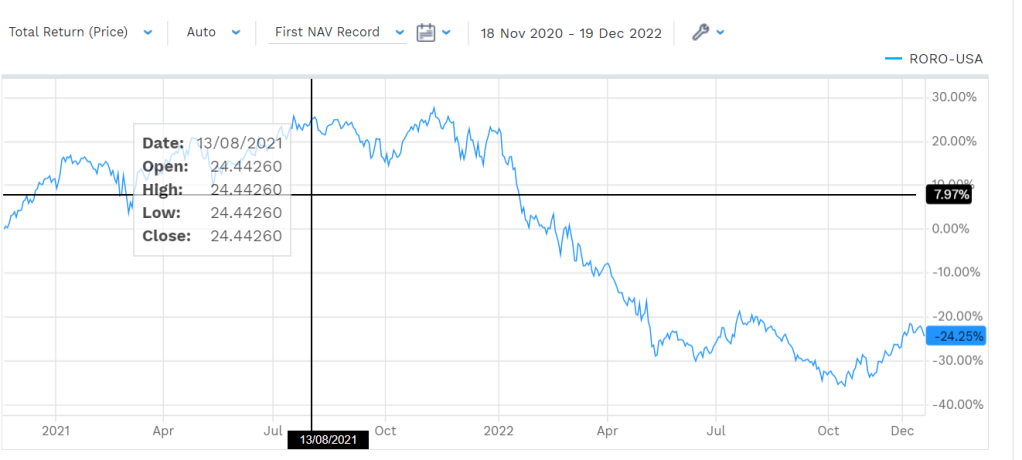
The ATAC US Rotation ETF (Ticker: RORO)
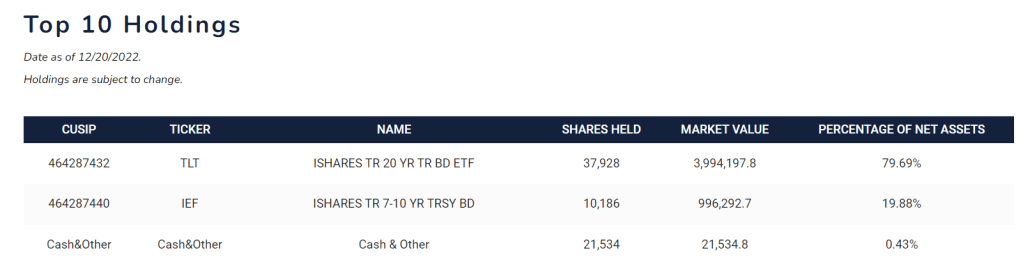
- In offensive mode, RORO can invest in U.S. small-cap and large-cap growth ETFs.
- In defensive mode, RORO can invest in long-duration Treasuries. The indicator is driven by the behavior of Lumber and Gold, a historically leading indicator of market volatility, which is evaluated on a weekly basis for potential rotations in the exchange traded fund.
There are several immediate questions:
- There are two leading indicators of market volatility, one is “Utilities relative to the broad stock market” and the other is “Lumber and Gold” a historically leading indicator. Both are evaluated on a weekly basis. Are they mesh with each other? why not use VIX the classical volatility signal?
- Why weekly, what about the lead-lag effect of data availability?
- How do you pick offensive and defensive bond/stock ETFs

As to the first question, the fund manager Michael Grayed has detailed his reasoning in the podcast.
“because I get people that would poke holes at it saying, “Oh, it’s some random relationship.” And these people, meanwhile, they’re saying that from their home, which has about 16,000 board feet of lumber.
So it’s not that it’s some magic relationship. Why is lumber relative to gold in this story of anything related to the stock market is because housing is the biggest driver of wealth? And the average home has about 16,000 board feet of lumber. So if housing is the biggest driver and most important aspect of the wealth effect, housing is what most people’s, again, wealth is in.
So lumber is a key component of that, and as lumber performs because of the long tail construction, as lumber performs, it tells you a lot about risk. It tells you a lot about credit creation, inflation, growth expectations, so on and so forth. Now, why compare it against gold? Because historically gold in many ways, similar to treasuries tends to be a risk-off play, meaning that when you have high volatility in the stock market, at least for a moment in time, gold tends to do fairly well during a flight to safety mode.
So when you compare the most cyclical commodity lumber to the most non-cyclical commodity gold and it tells you a lot about volatility. Same dynamic as moving averages. And it’s interesting because usually when lumber is weak relative to gold, you’re below a 50-day or 200-day moving average. When lumber is outperforming gold, your risk-on, you’re above moving average.”
“We warned you in advance of the conditions. Now, by the way, that doesn’t mean that every time utilities lead, you have an extreme VIX spike is that when you have an extreme VIX spike, utilities tend to already be leading. And we should revisit that because that’s actually an important distinction.
Now, 75% of the time, it’s pretty good. But of course, that means 25% of the time it misses it. And I always use that line on Twitter at the Lag Report, no signal is infallible in the small sample. Just because it’s training, doesn’t mean you’ll crash. Just because it’s sunny, doesn’t mean you won’t. There’s nothing that’s foolproof. So you have to play these probabilities based on indicators like utilities, play defense, recognizing that you could be wrong both ways, risk-on or risk-off. But more often than not, the odds are in favor. You can get it right when you most need to be right.
The interesting thing about utilities as a sector, going back to the ’20s is that’s a fairly remarkable and consistent phenomenon, meaning independent of legislative events that affected the utility sector independent of the decade. You tend to see that dynamic where if utilities are outperforming in the short term with a lag stock market volatility on average rises afterward, which means to me at least there’s a degree of conviction that that’s an anomaly that will probably persist because it’s already lasted for so many decades.
The VIX, as you know tends to be much more reactionary to volatility. So it’s volatility. The thing of the VIX has like the mile mark you crash your car. Utilities are the rate to that extent. And a very simple way of tracking it is you can just use ETFs like the utilities ETF, XLU relative to the S&P if utilities are outperforming over a very short-term basis, up more down, less relative. That will be your warning sign to play defense or to be careful.”
It does not sound sensible for me.
Performance is lack-luster