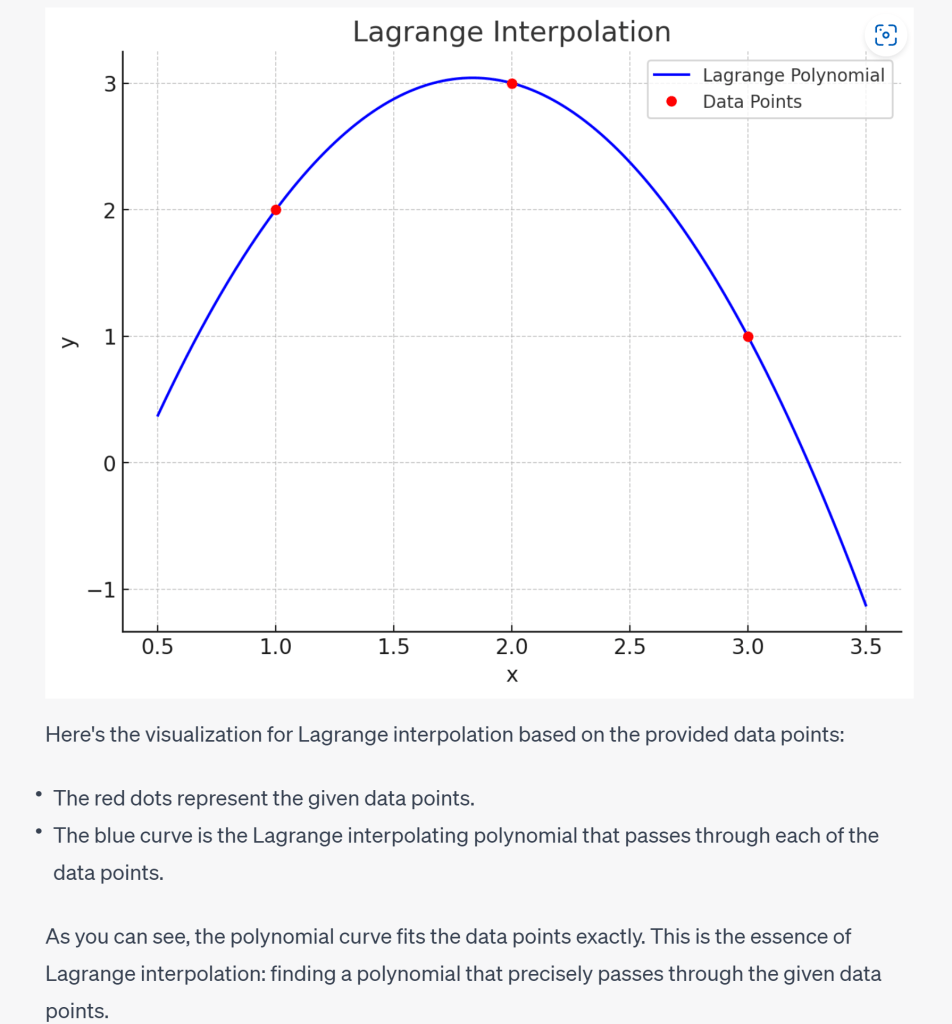
Lagrange interpolation is a method to find a polynomial to fit a given set of data points:

# Lagrange Interpolation
import numpy as np
import matplotlib.pyplot as plt

# Redefining the Lagrange interpolation function
def lagrange_interpolation(x, y, x_val):
    n = len(x)
    y_val = 0
    for i in range(n):
        l = 1
        for j in range(n):
            if i != j:
                l *= (x_val - x[j]) / (x[i] - x[j])
        y_val += y[i] * l
    return y_val

# Define data points
x_points = [1, 2, 3]
y_points = [2, 3, 1]

# Generate values for the interpolating polynomial
x_vals = np.linspace(min(x_points)-0.5, max(x_points)+0.5, 400)
y_vals = [lagrange_interpolation(x_points, y_points, x_val) for x_val in x_vals]

# Plotting
plt.figure(figsize=(8, 6))
plt.plot(x_vals, y_vals, 'b-', label='Lagrange Polynomial')
plt.plot(x_points, y_points, 'ro', label='Data Points')
plt.title('Lagrange Interpolation')
plt.xlabel('x')
plt.ylabel('y')
plt.legend()
plt.grid(True)
plt.show()
