Independent Component Analysis (ICA) is a statistical technique used for separating a multivariate signal into additive subcomponents. A common example application is the “cocktail party problem” of listening in on one person’s speech in a noisy room.
ICA is based on the assumption that the observed signals are linear mixtures of statistically independent source signals which at most one of them is Gaussian. This property is crucial for the separation process.
In stock analysis, ICA can be applied to decompose financial time series data into independent factors. This decomposition can reveal hidden factors that influence stock prices, helping in understanding market dynamics. For example, it can separate out underlying sources of variations in stock returns, which might be linked to different economic factors or market sentiments. By identifying these independent components, analysts can gain insights into the driving forces behind stock price movements, potentially improving portfolio management or investment strategies.
While ICA is prominently used in fields like signal processing and neuroscience (such as in EEG analysis), its application in stock market analysis is less straightforward but still quite interesting.
In the context of stock analysis, the idea of ICA is to treat the observed stock prices or returns as a mixture of various latent (hidden) factors or sources. These sources could represent various underlying economic, sectoral trends, macroeconomic factors, unobserved policy changes or even disruptive events such as COVID outbreak.
The math of ICA can be illustrated using a simple noiseless and linear signal combination in wikipedia:
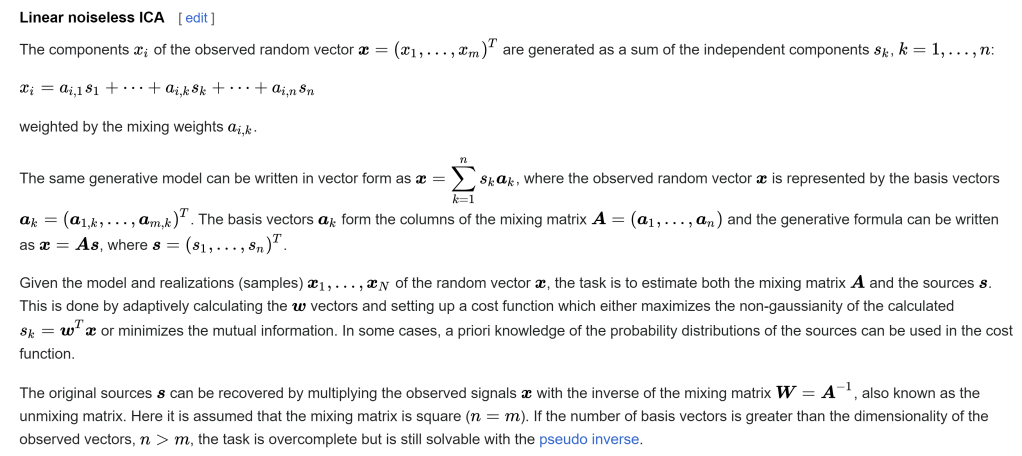
FastICA is an efficient and popular algorithm for performing ICA, known for its speed and robustness. It uses a fixed-point iteration scheme for maximizing non-Gaussianity, which often leads to faster convergence.
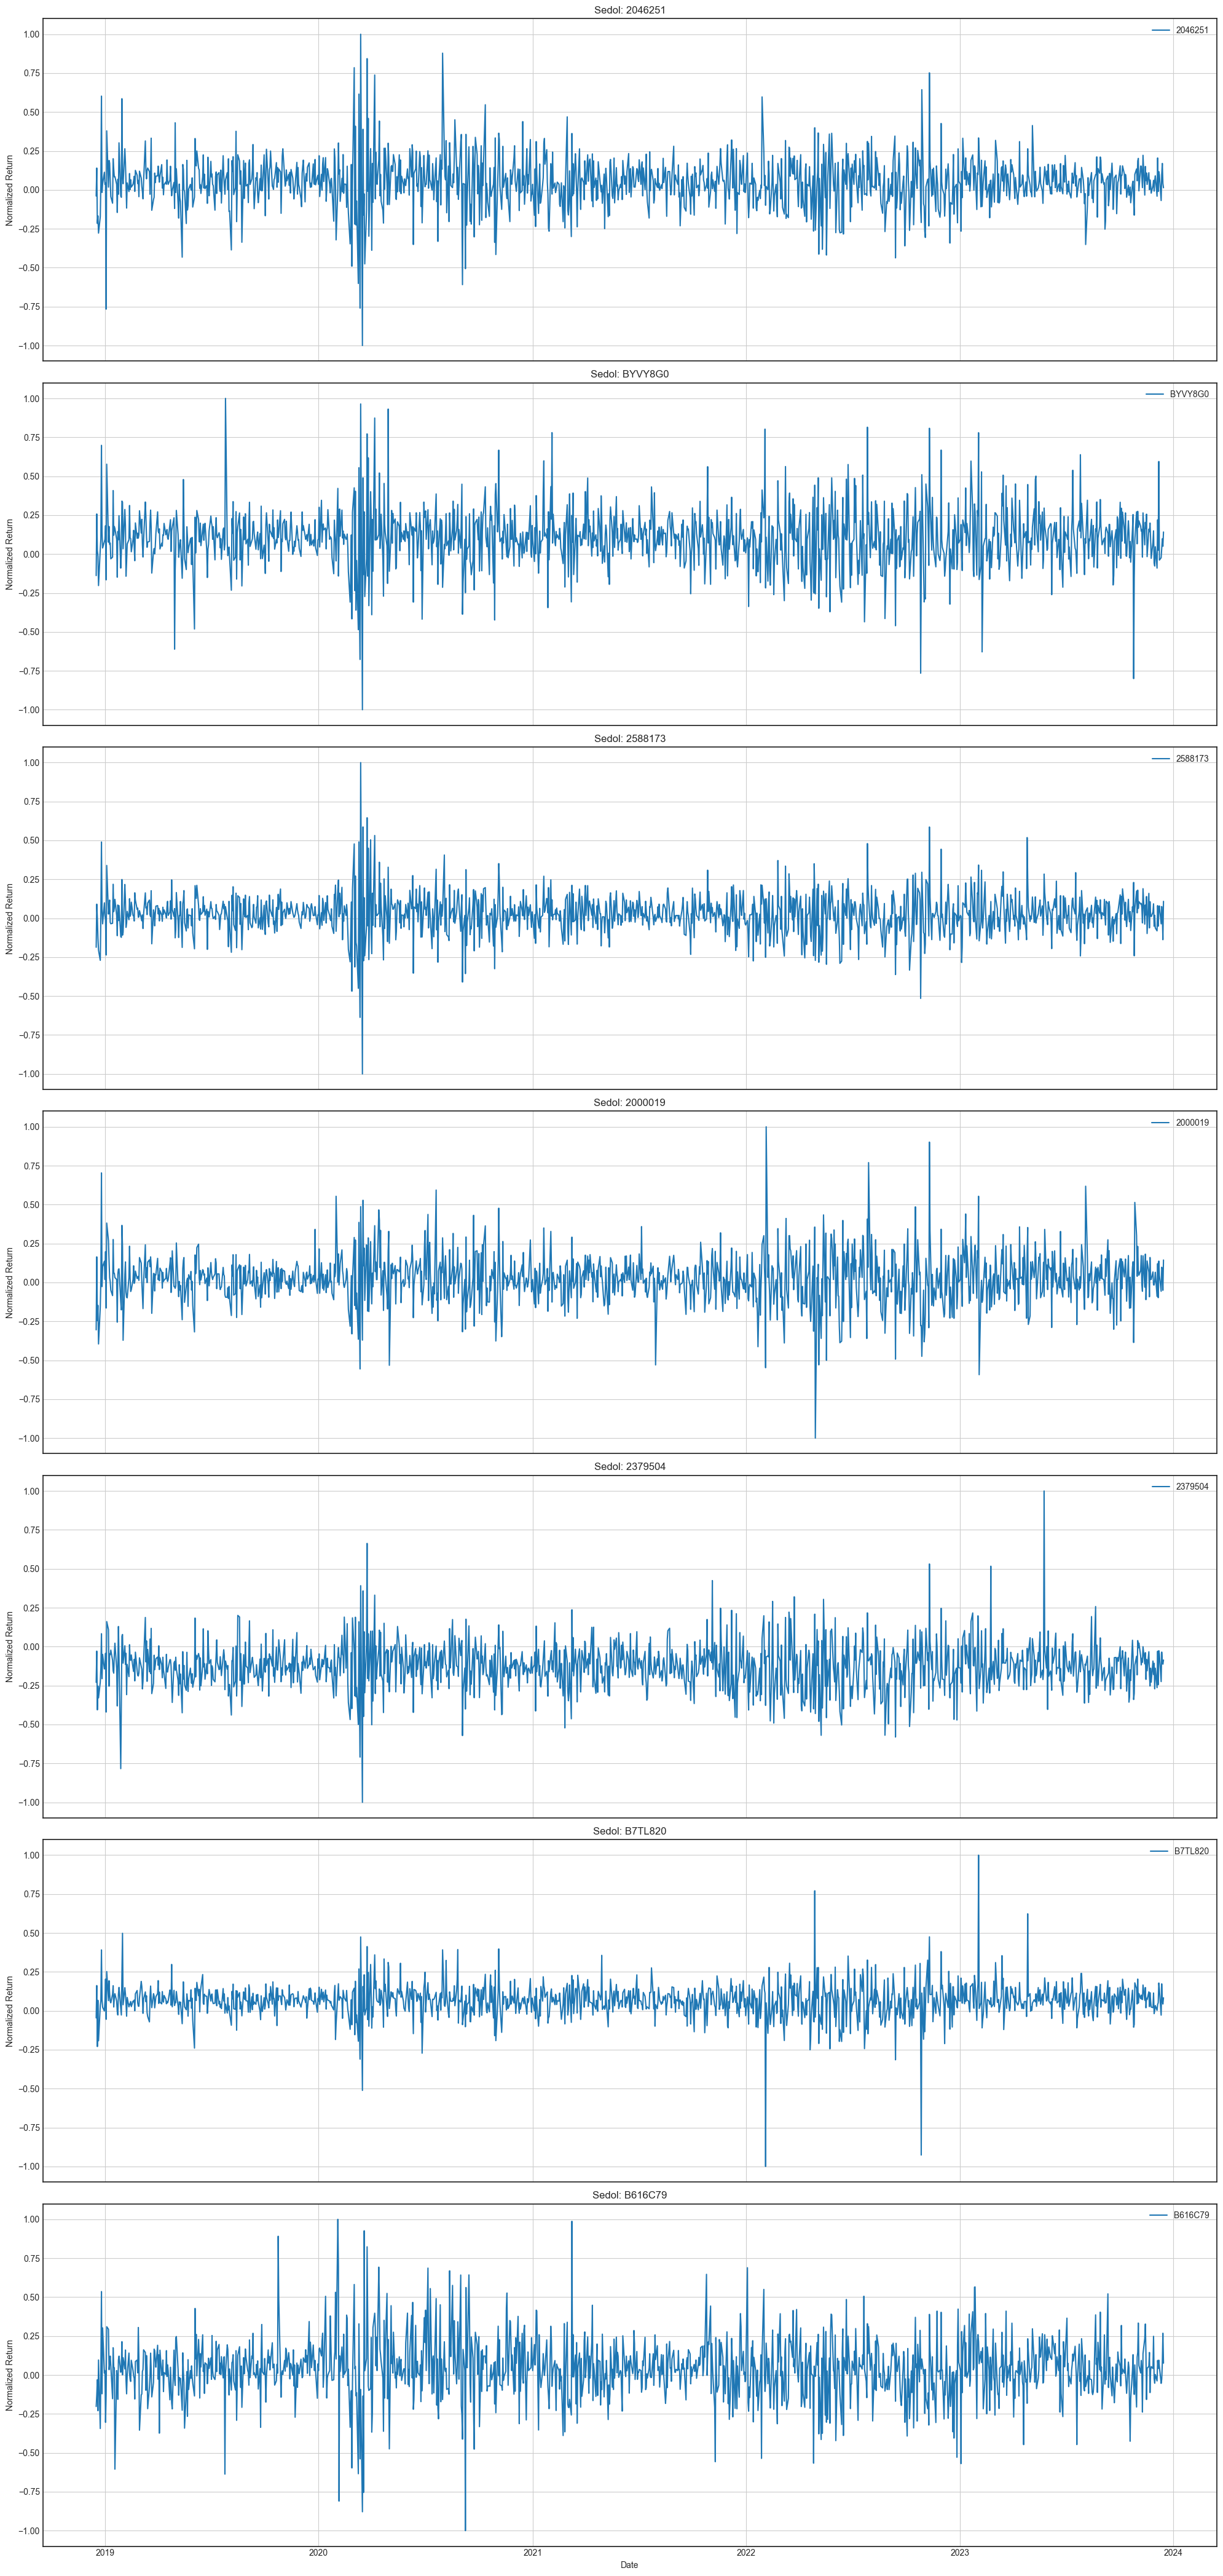
In this article, I investigate 7 top stocks in S&P 500 and collect five years daily return time series data, assuming there are 7 unknown independent components (ICs), and the 7 stocks represent various combination of these 7 factor sources. To ensure validity of ICA analysis, each time series are normalized between (-1, +1).
The below charts represent each stock’s daily normalized return over last five years, i.e. from 20181217 to 20231215.
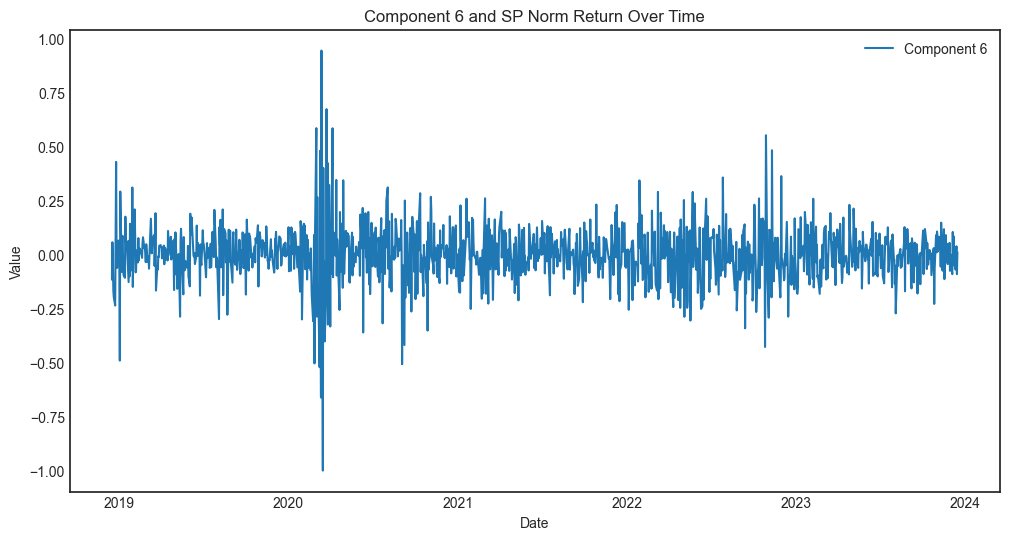
Next, apply FastICA, set number of components = 7 and plot each components as
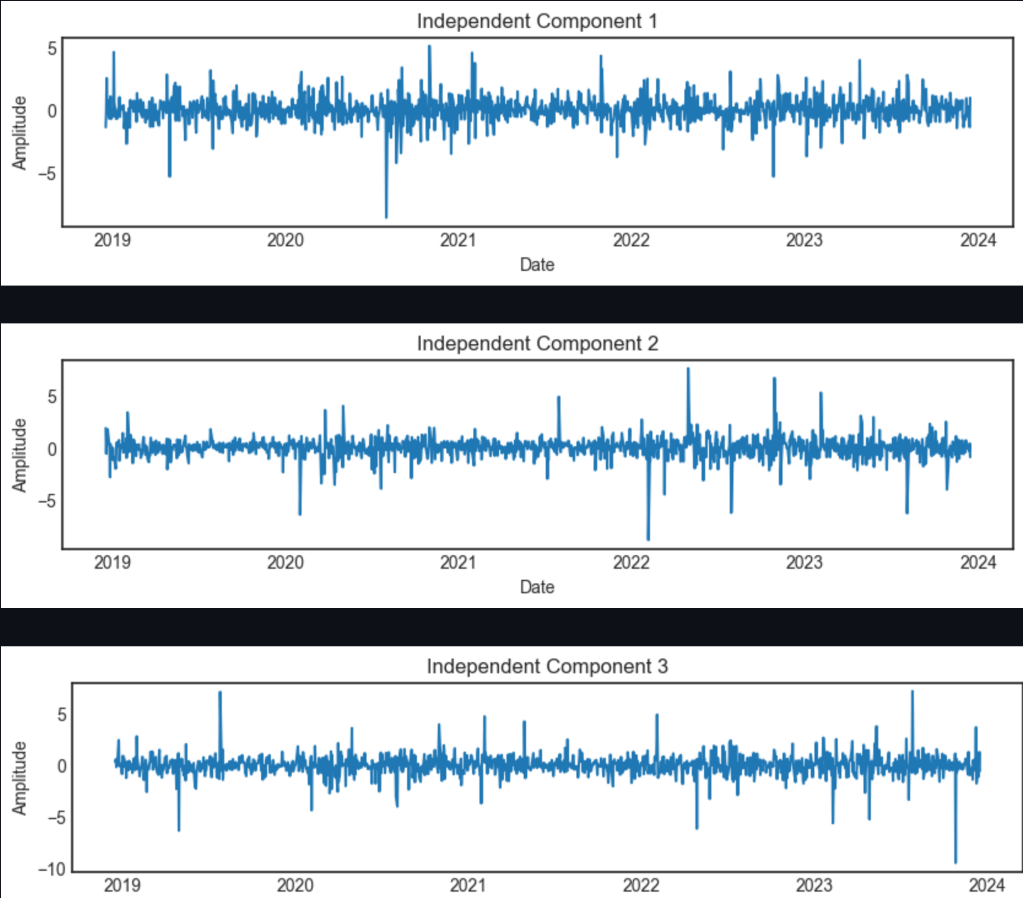
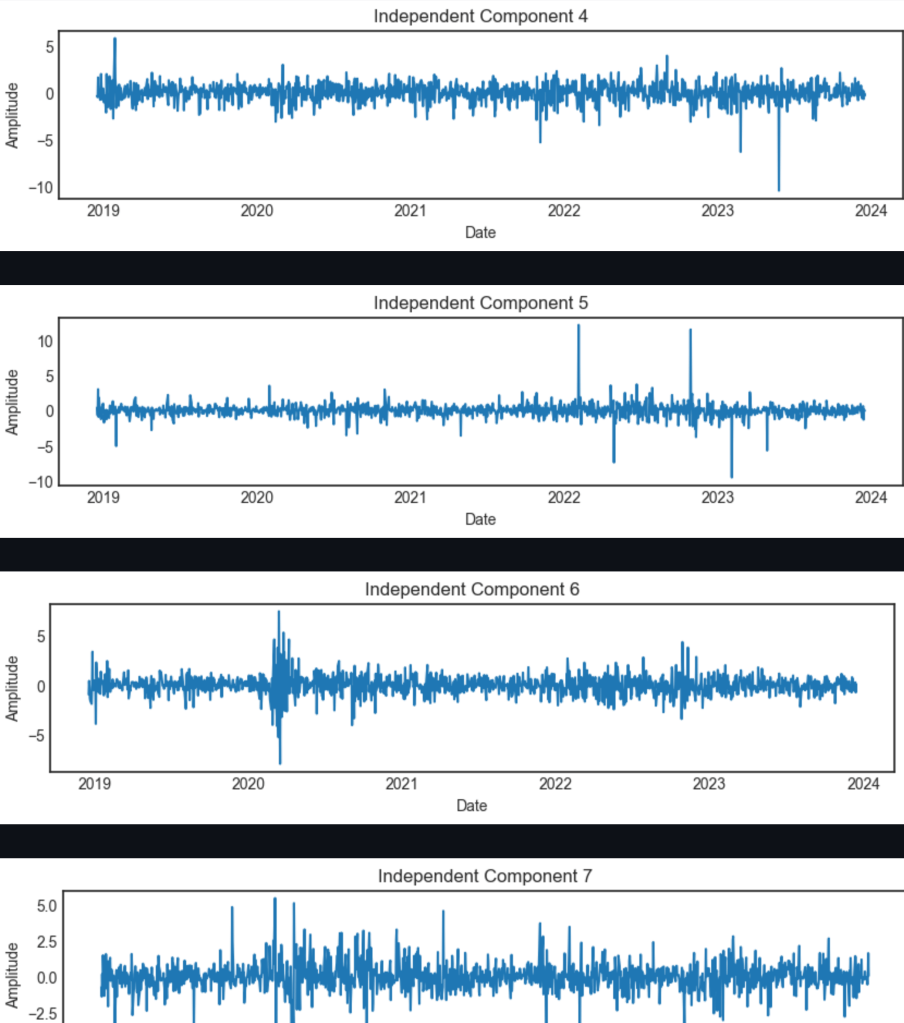
These 7 ICs displayed dinstinctive features. How much do they contribute explanation of total signals? We adopt an indirect approach. This involves reconstructing the data using each independent component separately and then measuring the variance of these reconstructions. The idea is to see how much of the total variance of the original data is captured when only one component is used for reconstruction at a time.
Component 1: 0.04
Component 2: 0.10
Component 3: 0.05
Component 4: 0.07
Component 5: 0.07
Component 6: 0.49
Component 7: 0.17
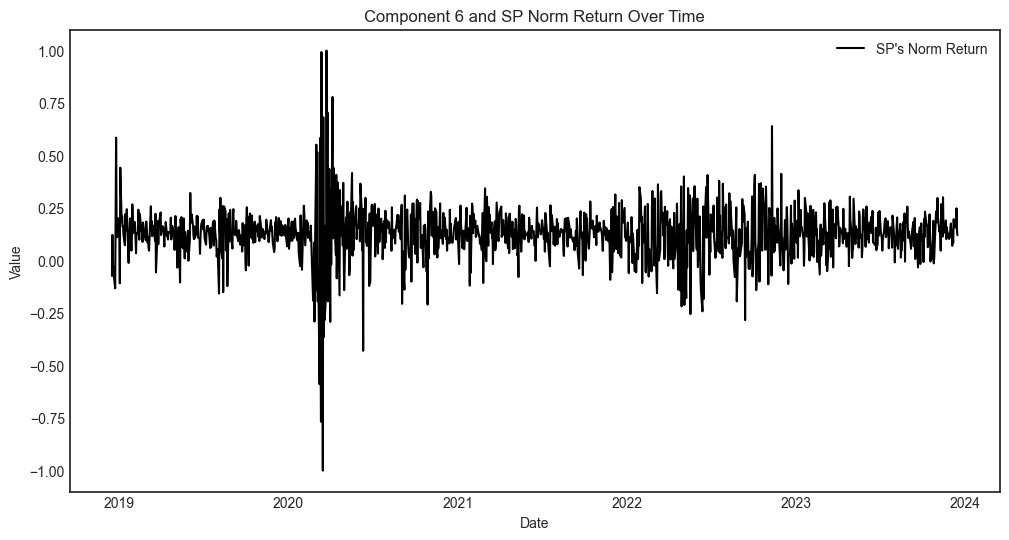
Component 6 explain almost 50% of the total variance. and the chart looks like the market signal, hence I use the S&P500 index daily normalized return to compare. It verified my guess, the two charts display similar pattern.
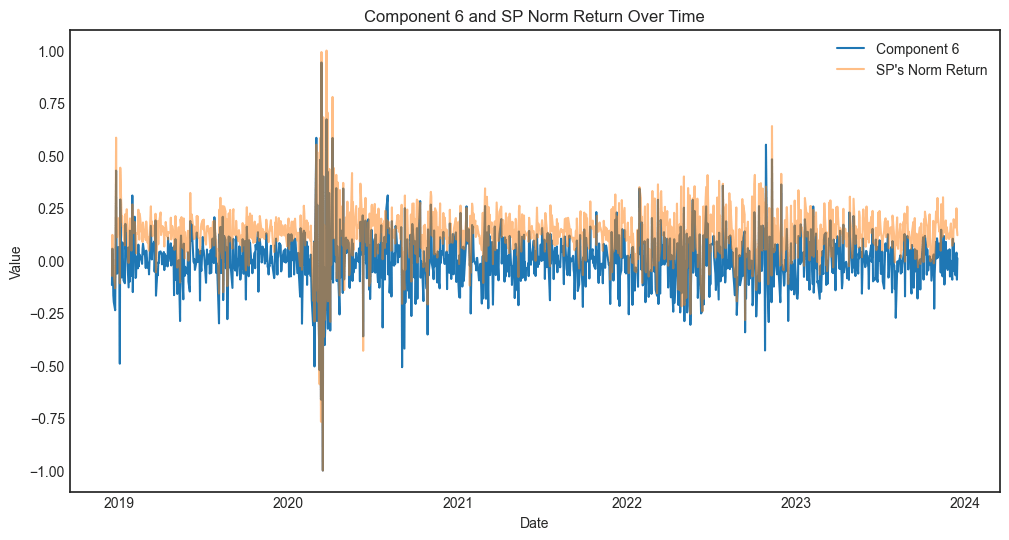
Seperate them to view closer, it’s clear the two are highly correlated. We can not concude that these 7 stocks are explained or passived moved up or down by the market though, it could entirely valid explanation other way around, i.e., US market performance is decided or dominated by the top 7 stocks.
On the other hand, I tested top 7 stocks in Taiwan and Japan market respectively, their assume IC didn’t have such US market characteristics:
The ICs of Japan are Component 1: 0.11 Component 2: 0.11 Component 3: 0.12 Component 4: 0.17 Component 5: 0.17 Component 6: 0.12 Component 7: 0.20;
while ICs of Taiwan are Component 1: 0.12 Component 2: 0.09 Component 3: 0.12 Component 4: 0.17 Component 5: 0.16 Component 6: 0.12 Component 7: 0.22.
