I collected daily Bitcoin and Ethereum price in past five years and test out simple momentum strategy as follows:
- Compute the momentum score by dividing each period’s end price by the price from one period ago and subtracting 1.
- Establish a hurdle rate of 10%.
- If the momentum score is greater than or equal to 10%, buy Bitcoin or Ethereum; otherwise, sell and hold cash.
- Rebalance periodically as performed over the past 5 years.
Here is the codes to realize this strategy
import pandas as pd
import matplotlib.pyplot as plt
import matplotlib.dates as mdates

class Portfolio:
    def __init__(self, price_data, currency):
        self.price_data = price_data
        self.currency = currency
        self.price_data.index = pd.to_datetime(self.price_data['date'])
        self.price_data = self.price_data.sort_index()

    def _calculate_returns(self, momentum_period):
        price_data = self.price_data.copy()

        momentum_column = f'momentum_score_{momentum_period}'
        momentum_days = {'7day': 7, '14day': 14, '1month': 30, '3month': 90, '6month': 180}

        if momentum_period in momentum_days.keys():
            price_data[momentum_column] = price_data[self.currency].pct_change(momentum_days[momentum_period])

        return price_data


    def rebalance_portfolio(self, hurdle_rate=0.1, momentum_period=None):
        self.returns_data = self._calculate_returns(momentum_period)
        momentum_column = f'momentum_score_{momentum_period}'
        self.returns_data['investment_strat'] = self.returns_data[momentum_column].apply(lambda momentum_score: 'buy' if momentum_score >= hurdle_rate else 'sell')

        # Initialize variables
        base_amount = 1_000_000
        cash = base_amount
        num_currency_held = 0.0
        first_buy_index = None

        for i, row in self.returns_data.iterrows():
            # On "buy" signal
            if row['investment_strat'] == 'buy' and cash > 0:
                num_currency_held += cash / row[self.currency]
                cash = 0
                if first_buy_index == None:
                    first_buy_index = i

            # On "sell" signal
            elif row['investment_strat'] == 'sell' and num_currency_held > 0:
                cash += num_currency_held * row[self.currency]
                num_currency_held = 0

            # Calculate portfolio value
            self.returns_data.loc[i, 'portfolio_value'] = cash + num_currency_held * row[self.currency]

        # Calculate portfolio return
        self.returns_data['portfolio_return'] = self.returns_data['portfolio_value'].pct_change()

        if first_buy_index is not None:
            self.returns_data.loc[first_buy_index:,'cumulative_portfolio_return'] = (1 + self.returns_data.loc[first_buy_index:,'portfolio_return']).cumprod() - 1

        # Calculate currency return
        self.returns_data[self.currency + '_return'] = self.returns_data[self.currency].pct_change()
        self.returns_data['cumulative_' + self.currency + '_return'] = (1 + self.returns_data[self.currency+'_return']).cumprod() - 1

        return self.returns_data


portfolio = Portfolio(price_data, 'eth')
momentum_days = {'7day': 7, '14day': 14, '1month': 30, '3month': 90, '6month': 180}
returns_data = {}

for period in momentum_days:
    returns_data[period] = portfolio.rebalance_portfolio(momentum_period=period)


# Plotting, and first Create dictionaries for colors and linestyle
colors = {'7day': 'blue', '14day': 'green', '1month': 'orange', '3month': 'purple', '6month': 'red'}
linestyles = {'7day': 'dotted', '14day': 'dashdot', '1month': 'dashed', '3month': 'solid', '6month': 'solid'}

fig, ax = plt.subplots()

# Loop and plot cumulative returns for each period
for period in momentum_days:
    ax.plot(
        returns_data[period].index,
        returns_data[period]['cumulative_portfolio_return'],
        color=colors[period],
        linestyle=linestyles[period],
        alpha=0.5,
        label=f"{period}")

# plot BTC cumulative returns
ax.plot(
    returns_data['7day'].index,
    returns_data['7day']['cumulative_' + portfolio.currency + '_return'],
    label=portfolio.currency.upper() + " Returns",
    color='black',
    linewidth=1)

ax.xaxis.set_major_locator(mdates.YearLocator())
ax.xaxis.set_major_formatter(mdates.DateFormatter('%Y'))

plt.title('Cumulative Portfolio Returns vs ' + portfolio.currency.upper() + ' Returns')
plt.xlabel('Date')
plt.ylabel('Returns')
plt.legend(title='Momentum Period', bbox_to_anchor=(1.04,1), borderaxespad=0) # place legend outside plot
plt.grid(True)

plt.show()
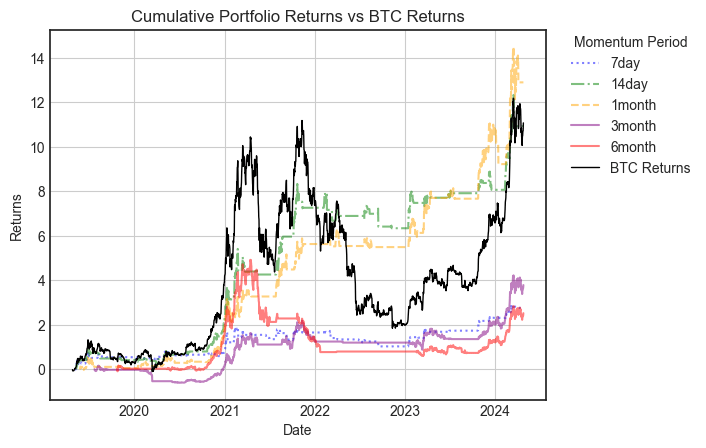
And the performance chart for Bitcoin is:
The performance chart for Ethereum is:
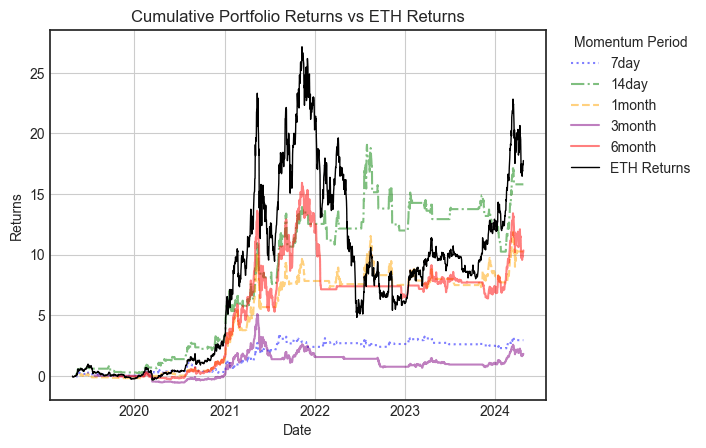
Conclusion: A momentum strategy can aid investors in maximizing returns while minimizing the significant volatility of Bitcoin or Ethereum investments, particularly when the period is controlled to approximately one month or 14 days for Bitcoin or Ethereum; shorter or longer periods are less ideal.
