After collecting time series data, statistical analysis is necessary to obtain understanding and decide potential strategies.
Collected daily price and metrics of fee ratio_mvrv count_exctransfer hash_rate total_issurance total_liquidation miner_revenue tansfer_value spot_volume
Note I shifted the metrics data one day forward to make the backtesting realistic as it is exactly what data is available on that day
From 20190419 to 20240509, transformed to daily return data, i.e. stationary data, then standardized and winsorized for data observation
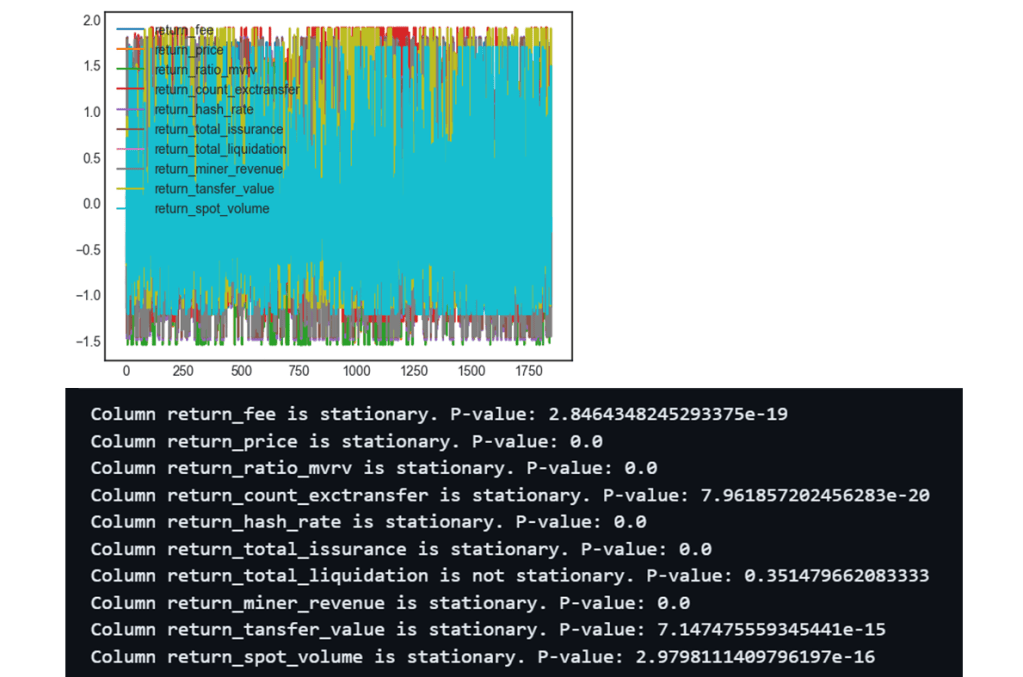
Correlation map, this can view directly how these data points are correlated to each other but can’t identify if there is lead-lag correlation existing;
From the heat map below, return_price and return_ratio_mvrv is correlation is almost 1, so is return_hash_rate and return_total _issurance, indicating these pairs are redundant data points.
It explains why MVRV Ratio showed “strong” signal in initial momentum strategy, the ratio of MVRV is literally replication of price data, hence not meaningful to use it for investing
Moreover, return_fee, total_liquidation and miner_revenue also demonstrates correlation: 0.19, 0.19 and 0.25 with price daily return

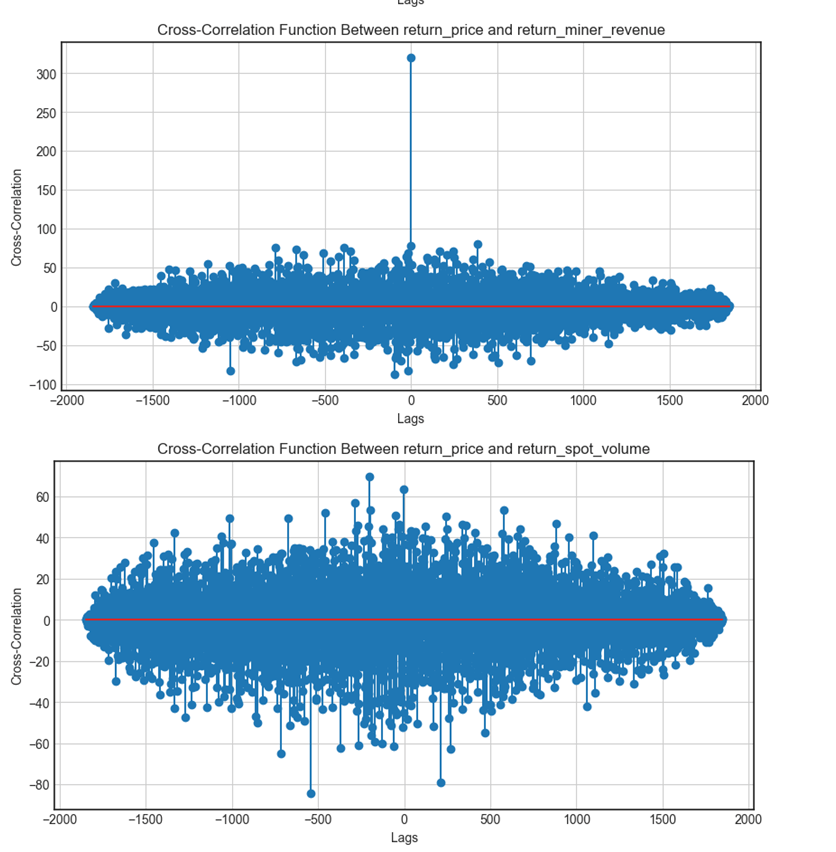
Cross Correlation Function (CCF) to verify and identify if there are data points highly correlated in lead-lag fashion. Consistent with correlation matrix above, mvrv has high correlation with price return in a lag fashion, so is miner revenue and price return, but not as strong, while spot volume doesn’t have such effect with price return.

Vector Autoregressive (VAR), fed to Anthropic for deeper insight:

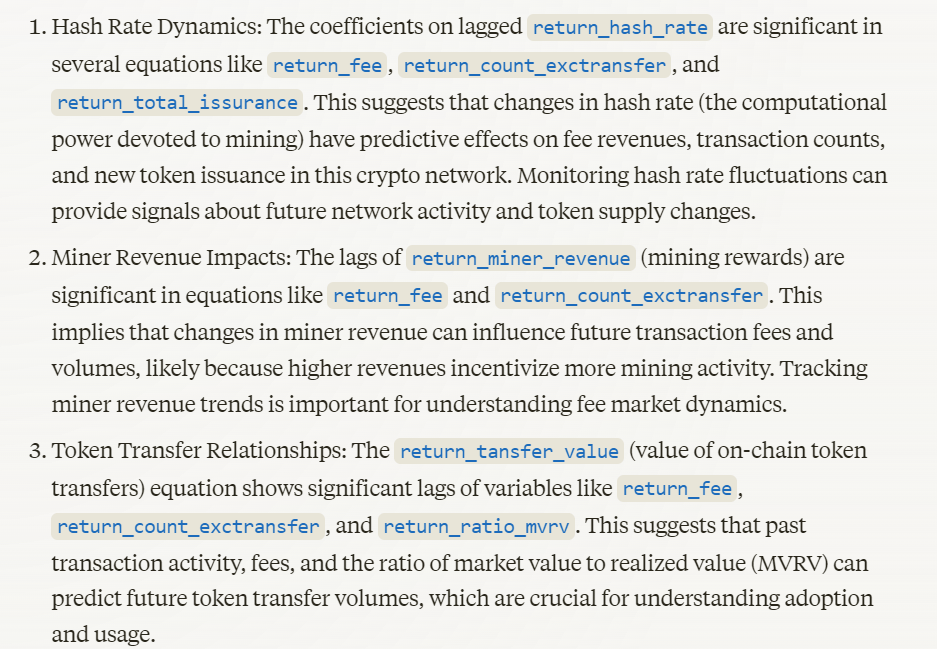
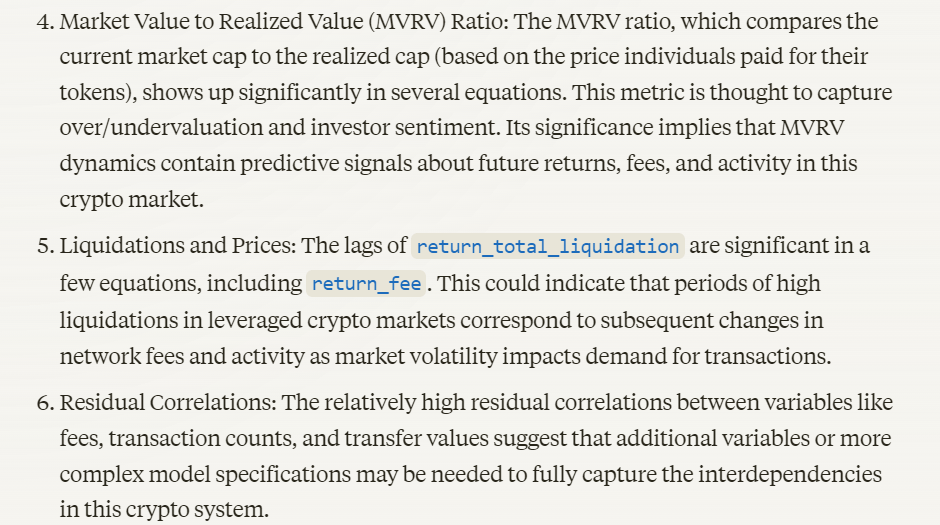
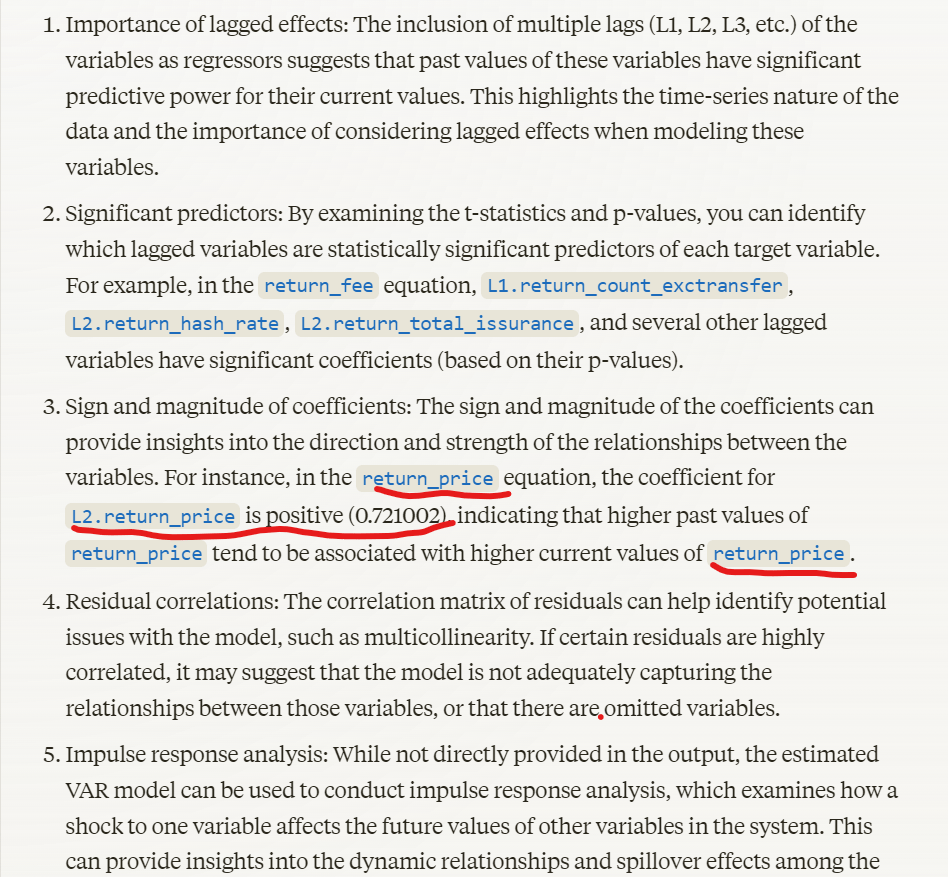
without prompting it as crypto expert, the insight purely based on math indicates price return has high autoregressive feature, backing up my attempt to use momentum strategy.
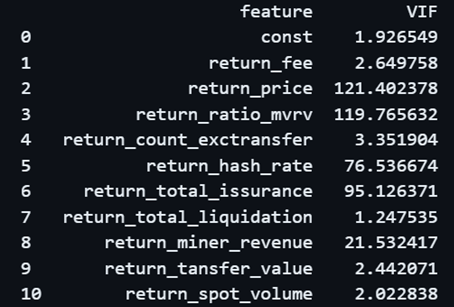
Variance Inflation Factor (VIF): A more formal detection involves calculating the VIF for each variable. VIF values greater than 5 indicate multicollinearity that may be too high.
Hence from below output, it verifies that ratio of MVRV, Hash Rate, Total Issurance and Miner Revenue is highly correlated with other variables
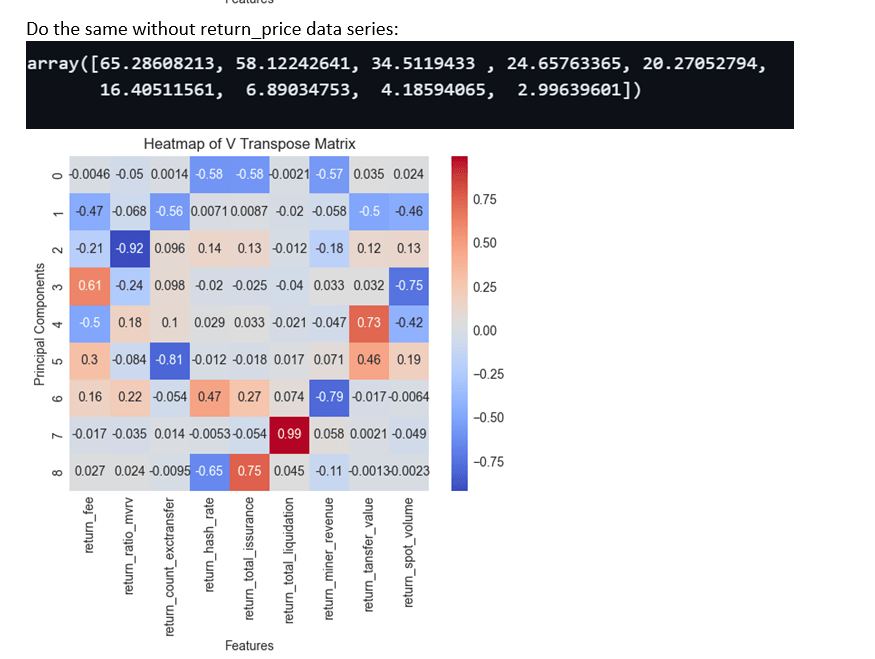
SVD it’s like PCA, also to view redundant features/metrics
The sigma/eigen values of SVD below indicate the 10 features can be represented by 5 to 4 principle eigen vectors(liner combination)


If remove the price return feature,
Step Wise Signal Selection, note I removed mvrv and total issuance(given hash rate is kept).
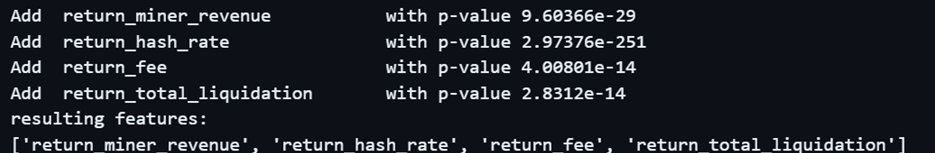
Hence in conclusion, we can choose
- Miner_Revenue
- Hash_Rate
- Fee,
- Total Liquidation
as signals for our crypto strategies.
