Following Rivikmath to go over time series analysis. This is the first one.
Before jumping into analysis of autocorrelation and partial autocorrelation, then to RAMA models, we need to prepare the data to be STATIONARY.
So the definition of stationary is the mean and standard deviation are constant and there is no seasonality. other than visual view, the augmented Dickey Fuller test is rigorous to identify if a time series is stationary or not. We can do tricks such taking log, do difference/subtraction, percentage to transform a series to stationary if previous it was not. Checked AI bot if bitcoin is stationary: “evidence of heavy tails, time-varying volatility, and lack of fit to common stationary distributions strongly suggests that the daily returns are likely non-stationary.”
Note the absolute value of the coefficient could be less than 1 (stationary), greater than 1(not, blow up) and unit root, which is tricky but it’s still not stationary after math.
If I conduct a direct correlation analysis for data points at time t and another past time, say t-2, it’s ACF, containing indirect correlation between caused by t-1 too. While PACF has direct effects by correlating all t to t-1. t-2. For example,
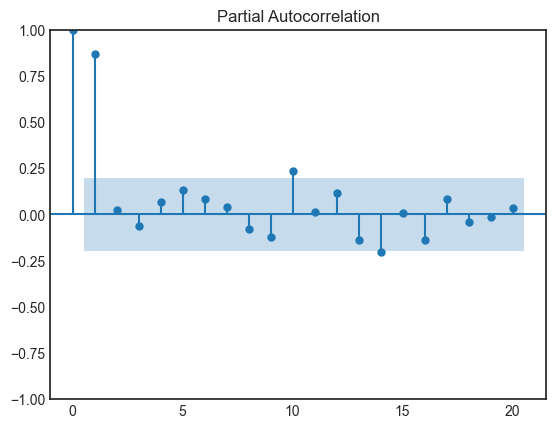
Use PACF we can decide which lag to be included in AR model. Learn to evaluate how good the model is, and apparently, the prediction attenuates in distant future, to address this issue, we can use rolling forecast adjustment.

Another important model is MA (moving average) model. It’s the regression equation incorporating error terms in lagged time periods, for example.

There are stats package to use directly, note the three parameters in ARIMA model defines the lagging for RA part, integration part (difference, say t – t-1 is 1) and MA part, such as

How do we know if the MA(q) model is good fit, with some math deduction detailed here, using ACF and if the variance shut off after passing k, q point, then we’re confident the MA is fine.
In applying ARMA model, note even if using PACF and find only say, lag 4 is significant, in the AR equation, we still include L1, L2, L3 parts for validity.
There is a stock trading model using ARMA model with rigorous process for reference!
Lastly you can run various time frame and draw Gaussian plot to have a holistic estimate of the models, particularly for time series, the technique is called Rolling Forecast Origin.
Adding on how to select various AR models systematically? The universal tool is AIC and BIC which involves understanding of log likelihood, number of parameters, number of sampling used for fitting n.

