This analysis focuses on the Russell 2000 index as a representation of the U.S. small-cap market, assessing passive and active ownership percentages over a 10-year period with quarterly rebalancing. We divided the index constituents into terciles by market capitalization, keeping only the lowest tercile (about 600 component stocks) to better capture true small-cap stocks. This approach was chosen due to the lack of constituent data for the MSCI USA Small Cap index.
By applying the Version 1 passive-tilt weighting strategy (discussed in a previous blog), we observed improved performance, in contrast to large-cap stocks. This indicates that within the small-cap segment of the U.S. market, tilting towards stocks with higher passive ownership could enhance returns.
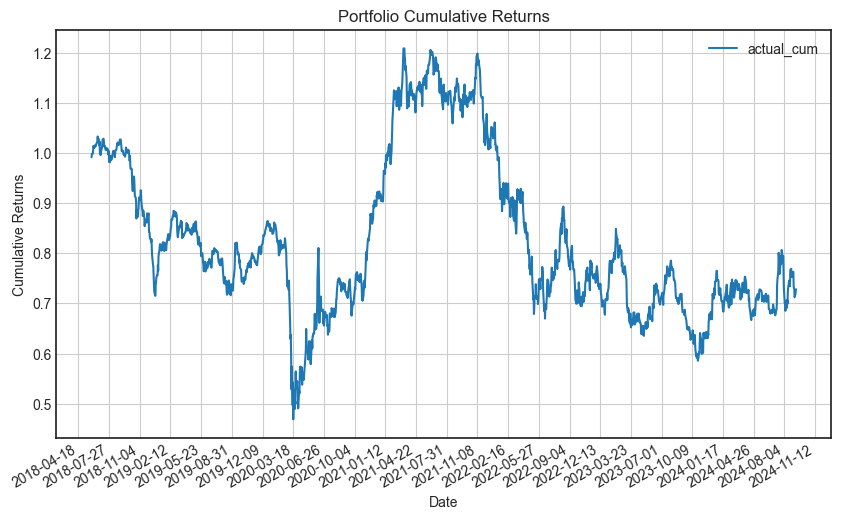
Here is the return data: from February 28, 2014, to September 11, 2024, the cumulative return for the market cap-weighted strategy was 0.693261. In comparison, the passive tilt-weighted strategy delivered a higher return of 0.728279, while the equal-weighted strategy returned 0.578821. The 1-passive tilt weighted strategy had a return of 0.656499. It’s worth noting that unlike the strong performance of large-cap stocks, small-cap stocks actually experienced losses over the 10-year period.
Hence, we can roughly concluded that the passive-tilted strategy performed well for small-cap stocks, while the 1-minus-passive tilted strategy was more effective for large-cap stocks in US market in last decade.
passive-tilt-weighted:
1-passive-tilt-weighted:

