If I measure three points in a space with three temperature, it’s easy and straightforward to interpolate every point in this triangle so I have a smooth view approximately. We can use simple weighting schema depending on distance to each of the three points.
It’s exactly the same logic to be applied when elevate to 2-form, 3-form etc even it would be more difficult to grasp intuitively,
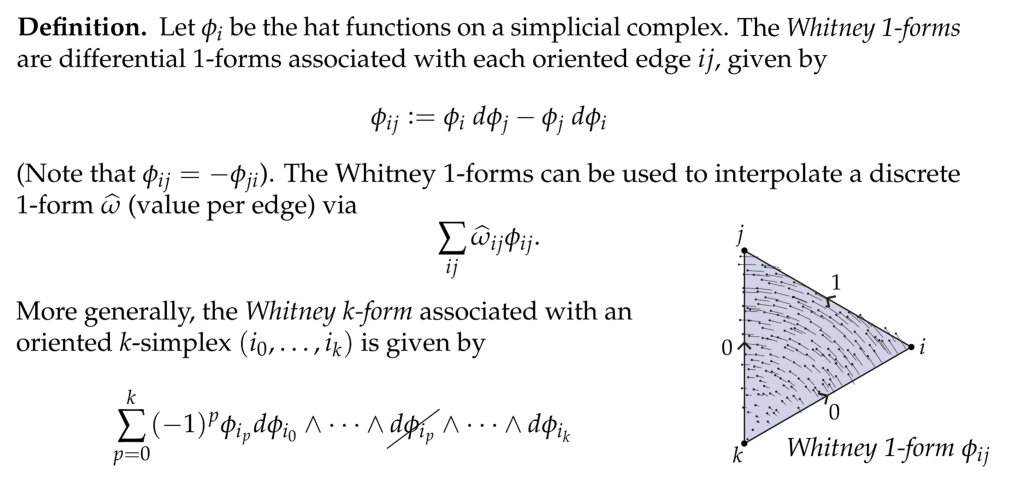
In below example, Whitney map is applied:
here is example in codes
# Define edge values for a Whitney 1-form (e.g., circulation along edges)
c01, c12, c20 = 1, -0.5, 0.8  # Values assigned to edges

# Compute Whitney 1-form interpolation
Wx = c01 * lambda0 * lambda1 + c12 * lambda1 * lambda2 + c20 * lambda2 * lambda0
Wy = c01 * lambda0 * lambda1 + c12 * lambda1 * lambda2 + c20 * lambda2 * lambda0

# Plot the interpolated vector field (Whitney 1-form)
plt.figure(figsize=(6, 5))
plt.triplot(tri, 'k-', lw=1)  # Triangle outline
plt.quiver(X, Y, Wx, Wy, scale=2, color='blue')  # Vector field inside the triangle

plt.title("Whitney 1-Form (Vector Field Interpolation)")
plt.xlabel("X-axis")
plt.ylabel("Y-axis")
plt.show()


Next key thing/tool is the sparse matrix representation in DDE:

