Strong individuals will increasingly gain power as they take on projects that previously required hundreds or thousands of engineers, now made feasible with the assistance of AI tools.
This blog will be about Dash framework of plotly and the next about the structure of portfolio and calculation py files.
Plotly is a powerful data visualization library that offers a wide range of tools for creating interactive charts and dashboards. Plotly can eliminate the need to build an HTML app from scratch for your portfolio analysis tool. Plotly provides several options for creating interactive interfaces: Plotly with Dash: Dash is Plotly’s web application framework that allows you to build interactive web applications entirely in Python. Plotly Express: A high-level interface for Plotly that makes it easy to create interactive visualizations with minimal code. Here are the major components and tools in Plotly:
1. Core Plotting Libraries
Plotly Express (px)
- High-level API for quick and easy plotting
- Simple syntax for common chart types
- Examples:
px.line(),px.bar(),px.scatter(),px.pie() - Great for rapid prototyping and simple visualizations
Plotly Graph Objects (go)
- Low-level API offering more customization
- More verbose but provides complete control over chart elements
- Examples:
go.Figure(),go.Scatter(),go.Bar(),go.Heatmap() - Ideal for complex or highly customized visualizations
2. Chart Types
- Basic Charts: Line, bar, scatter, area, pie, donut
- Statistical Charts: Box plots, violin plots, histograms, density plots
- Financial Charts: Candlestick, OHLC, waterfall
- Scientific Charts: Heatmaps, contour plots, 3D surfaces
- Maps: Choropleth, scatter geo, line geo
- Specialized Charts: Sunburst, treemap, parallel coordinates, radar charts
3. Interactive Features
- Hover Information: Tooltips and hover data
- Zoom and Pan: Ability to explore data by zooming and panning
- Click Events: Capture user clicks for interactivity
- Animations: Animate transitions between states
- Range Sliders: Filter data by time or other dimensions
4. Layout and Styling
- Layout Configuration: Control axes, titles, legends, and annotations
- Theming: Apply predefined themes or create custom themes
- Color Scales: Wide range of built-in color scales or custom palettes
- Annotations: Add text, shapes, and arrows to highlight data points
5. Integration Tools
Dash
- Web application framework for building interactive dashboards
- Combines Plotly visualizations with React.js components
- Allows for callbacks and interactivity without JavaScript
- Perfect for portfolio analysis dashboards
JupyterDash
- Run Dash apps directly in Jupyter notebooks
- Great for exploratory data analysis
6. Export and Sharing
- Static Export: Save as PNG, JPEG, SVG, or PDF
- HTML Export: Save as interactive HTML files
- Plotly Chart Studio: Cloud-based platform for sharing visualizations
7. Performance Tools
- Partial Bundling: Load only necessary components
- WebGL Rendering: High-performance rendering for large datasets
- Decimated Data: Efficiently display large datasets
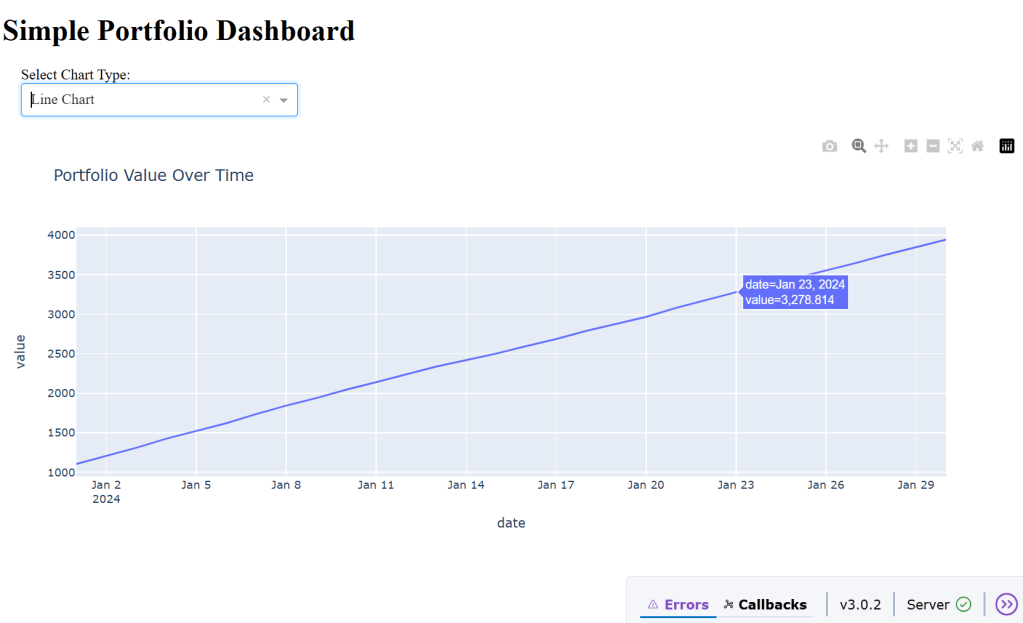
Let’s build a simple dash-based app to grasp the tool.
import subprocess
def install_packages():
  packages = [...]
  for package in packages:
    try:
      subprocess.check_call([sys.executable, "-m", "pip", "install", package])
    except subprocess.CalledProcessError:
       return False
def simple_dash_app():
  app_code = """ import dash from dash import dcc, html from dash.dependencies import Input, Output import plotly.express as px
   # Initialize the Dash app app = dash.Dash(__name__)
   # Define the app layout
   app.layout = html.Div([html.H1("Simple Portfolio Dashboard"),
                dcc.Dropdown(id='chart-type', options=[{label': 'Line Chart', 'value': 'line'}, {'label': 'Bar Chart', 'value': 'bar'}], value='line')], style={'width': '300px', 'margin': '20px'}), doc.Graph(id='portfolio-chart')])
    # Define callback to update the chart
    @app.callback(Output('portfolio-chart', 'figure'),
    [Input('chart-type', 'value')]
)
    def update_chart(chart_type):
      if chart_type = 'line':
        fig = px.line(df, x='date', y='value', title='Portfolio Value Over Time')
  #run the app
  if __name__ == '__main__':
    app.run(debug=True, host='127.0.0.1', port=8050)
    with open("simple_dash_app.py", "w") as f:
      f.write(app_code)
def main():
  create_simple_dash_app()
    # Run the Dash app
    try:
        subprocess.check_call([sys.executable, "simple_dash_app.py"])
    except subprocess.CalledProcessError:
        print("Failed to run the Dash app.")
    except KeyboardInterrupt:
        print("\nDash app stopped by user.")
if __name__ == "__main__":
main() 